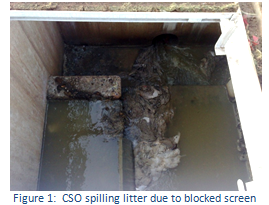
 Combined Sewer Overflows (CSOs) are used to divert excess sewer flows during storms. One problem with CSOs is that sewage debris and litter of various kinds washed into the drains by a storm can foul the discharge screen or be discharged from the CSO into the natural environment. Figure 1 shows a CSO spilling litter to a receiving water due to a blocked screen.
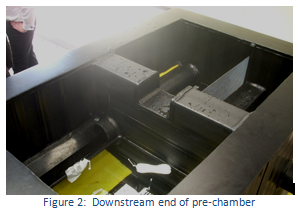
In a novel CSO design, the inflow into the CSO first passes through a primary (stilling) chamber where separation of litter occurs. The litter passes over a low level weir in the primary chamber into a pipe which bypasses the spill chamber and rejoins the sewer downstream. The pass forward flow, free of litter, passes into the downstream (spill) chamber where, due to the increase in surcharge of the system, it discharges from the CSO via the screens. This arrangement prevents the litter from fouling the discharge screen or being released into the environment due to overtopping of blocked screens.
 In support of this novel design, CHAM used its mainstream PHOENICS simulation software to create a model of the CSO chamber and perform a simulation of its filling and emptying process, in order to provide proof of concept results for its operation. The designer’s objective was to demonstrate that the CSO would separate successfully the bulk of the accumulated litter in the CSO primary chamber during filling and emptying of the chamber.
Using computational fluid dynamics, the designer can experiment readily with different design configurations, and assess their relative performance on a cost-effective basis, in order to discard the less favourable and establish the likely optimum design solution, before expensive physical experimentation or construction of a full-scale prototype become necessary.
The objective of the CFD study was to model the transient (time-dependent) filling and emptying process encountered in a storm surge, including the filling and emptying cycle. The purpose was to demonstrate the separation efficiency of the primary chamber and the bypass pipe in carrying away the unwanted litter material at various water levels; viz, when the weir in the primary chamber was (a) not operating, (b) spilling, and (c) flooded.
The most challenging aspect of the project was to determine a robust technical approach to handling the free water surface in the model. It was clearly important that the rise and fall of the surface level should be handled. The methodology chosen to represent the three phases present in the system (water, litter and air) was the PHOENICS Algebraic Slip Model (ASM). This is based on the modelling assumption that there is a single continuous phase containing other dispersed components whose motion (slip velocity) relative to the continuous phase is given by an algebraic relationship involving local hydrodynamic variables.
Local volume fractions for each component are then determined from individual conservation equations, with the constraint that the component fluxes across each cell face should be compatible with the corresponding mixture flux. This method allows for multiple phases to be computed and provides a way of describing the free-surface formed between the water and the air.
The time-varying inflow rate of water and litter into the domain, representative of a storm event, was described by a curve and input straightforwardly into PHOENICS using the input of formulae feature. The proportion of litter introduced via the inlet varied with the inflow rate, ranging from an initial rate of 5% by mass, escalating to 20% at peak inflow rate, and reducing thereafter. This curve was specified as a fill/empty cycle over the course of an hour.
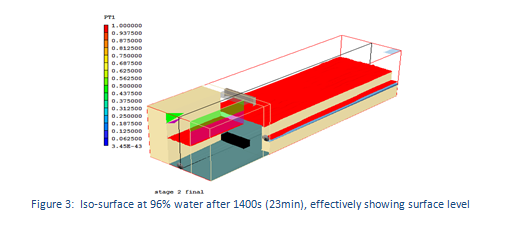
A snapshot of the model, showing water surface levels after 1400s (23 minutes), is shown in Figure 3.
In Figure 3, the green rectangle at the top on the left represents the open space above the discharge screen (represented in purple). The small red rectangle below it is the water surface in the spill chamber. The large red area on the right is the water level at the bypass weir in the primary-chamber, which can be seen lapping over the weir; and the thin red area on the right is the flow in the bypass overflow channel beneath the weir.
The results were provided in the form of a table showing the proportions of the water and litter flowing into the CSO chamber that are (i) bypassed to the downstream sewer, and (ii) passed forward via the continuation pipe to the spill chamber; and also, the proportions of flow and litter discharged to the receiving water under varying circumstances.
The promising data obtained from the CFD model are incorporated with the prototype scale model of the new CSO being trialled live in order to confirm that the CSO operates to expectation.